Last year, we published our analysis asking whether the price of silver could reach $100 per ounce. At the time, silver was trading around $33, and the idea of triple-digit silver seemed ambitious. The gold-to-silver ratio sat above 89:1, the Federal Reserve hadn’t yet begun cutting rates, and most mainstream analysts dismissed $100 silver as a fringe prediction.
Then it happened.
On January 29, 2026, silver hit an intraday high above $121 per ounce — shattering the $100 barrier and setting a new nominal all-time record. The move was explosive: silver surged more than 60% in less than a month, climbing from $72 on January 1 to its peak in under four weeks.
The pullback since then has been sharp but orderly. Silver corrected to $67 in early February, recovered to $95 by March 1, and has been building a base in the $65-$77 range through late March and into April. As of this writing, silver is trading near $77 per ounce, climbing steadily week over week.
The question is whether silver will get $100 again — and whether this time it stays.
We believe it will, and the conditions supporting that thesis are stronger today than they were during the January breakout.
What Drove Silver to $121 in January
The January spike wasn’t a single catalyst — it was the culmination of structural forces we identified in our original analysis, all converging at once.
Gold led the way, breaking above $5,000 per ounce for the first time on January 26 and peaking at $5,589 two days later. Silver followed gold’s lead but outperformed it dramatically, as it historically does during precious metals bull markets. The gold-to-silver ratio compressed from above 89:1 in late 2024 to approximately 46:1 at silver’s peak — a violent repricing of silver relative to gold.
The physical market was already tight heading into 2026. COMEX registered silver inventories had fallen 75% from their 2020 peak. LBMA vault holdings were down 40%. Silver lease rates, which normally sit at 1-3% annually, spiked to levels not seen in decades as industrial consumers and investors competed for dwindling physical supply.
Tariff fears added fuel. With the U.S. importing roughly 70% of its silver from Canada and Mexico, uncertainty around trade policy drove metal into U.S. warehouses, tightening global supply further and contributing to a short squeeze on futures contracts.
Why Silver Is Setting Up for Another Run Above $100
The January spike proved that triple-digit silver is achievable. But the conditions that created it haven’t resolved — in many cases, they’ve intensified.
The Supply Deficit Is Now in Its Sixth Consecutive Year
The global silver market has run in deficit every year since 2021. The cumulative shortfall over those five years is approximately 820 million ounces — nearly a full year of mine supply. The Silver Institute projects another deficit of 67 million ounces in 2026, and new mine production isn’t growing fast enough to close the gap.
This isn’t a temporary imbalance. Silver mine output has been essentially flat since 2016, and new mining projects require 7-10 years from discovery to production. There is no supply cavalry coming.
COMEX and LBMA Inventories Continue to Drain
The inventory situation at the world’s two largest silver trading venues remains critical. COMEX registered inventories are down approximately 75% from their 2020 peak. LBMA vaults have lost roughly 40% of their holdings since 2021.
In early 2026, COMEX faced a situation where 366 million ounces of open interest in silver contracts were scheduled for March delivery against only 102 million ounces of available registered inventory. While most contracts are rolled forward rather than settled physically, the mismatch highlights how thin the physical market has become.
Silver lease rates remain elevated, and the market has periodically entered backwardation — where spot prices exceed futures prices — a classic signal of physical tightness that rarely occurs in normally functioning commodity markets.
Industrial Demand Is Structural and Growing
Roughly half of all silver demand comes from industrial applications, and the three biggest growth drivers — solar energy, electric vehicles, and AI infrastructure — show no signs of slowing.
Solar photovoltaic installations consumed approximately 120-125 million ounces of silver in 2025, up from just 11% of industrial demand a decade earlier. While manufacturers are working to reduce silver intensity per cell, the sheer volume of new solar capacity being built globally — forecast at 665 GW in 2026 — more than offsets those efficiency gains.
AI data centers represent a newer but potentially significant demand source. Silver-plated copper connectors are used in high-density power delivery systems to minimize resistance and prevent overheating. Analysts estimate that even modest adoption of silver-enhanced components across new global data centers could increase industrial demand by 5-10% over the next decade.
Electric vehicle production continues to accelerate, with each EV using approximately 25-50 grams of silver in electrical contacts, sensors, and battery management systems.
The Gold Bull Market Is Far From Over
Gold’s performance provides the macro backdrop for silver’s bull case. After gaining 64% in 2025 — its best annual performance since 1979 — gold pulled back from its January high of $5,589 but remains above $4,600 as of early April 2026.
Major bank forecasts remain overwhelmingly bullish on gold: Goldman Sachs raised its year-end target to $5,400, J.P. Morgan sees prices pushing toward $5,000 by Q4, and UBS has a target of $6,200 with potential upside to $7,200.
Historically, silver outperforms gold during the later stages of precious metals bull markets. The January spike demonstrated this perfectly — gold rose roughly 20% to its peak while silver doubled. If gold retests $5,000 or pushes to $6,000, silver’s beta to gold suggests it could comfortably trade above $100 on a sustained basis.
The Gold-Silver Ratio Favors Silver
The gold-to-silver ratio currently sits near 64:1 — close to the historical average of 60-70:1. But during major silver bull markets, the ratio compresses far below this average. In April 2011, it dropped to 31:1. In January 2026, it briefly touched 46:1 before snapping back.
At today’s gold price of ~$4,800, a ratio of 48:1 would put silver at $100. A ratio of 40:1 — well within historical precedent during silver bull markets — would put silver at $120. If gold pushes to $6,000 (within the range of several major bank forecasts), even a conservative 60:1 ratio implies silver at $100.
The math is straightforward: as long as gold stays elevated, silver doesn’t need exceptional conditions to reach triple digits again. It just needs the ratio to compress moderately.
What Could Prevent Silver From Reclaiming $100
No investment thesis is without risk. Several factors could delay or prevent silver’s return to triple digits.
Federal Reserve Policy Reversal
Silver’s January breakout coincided with expectations of continued monetary easing. If the Fed pivots hawkish — raising rates or signaling an end to balance sheet expansion — the dollar could strengthen and take pressure off precious metals. That said, the current fiscal trajectory makes sustained tightening politically difficult, and most forecasters expect accommodative policy through 2026-2027.
Industrial Demand Disruption
A global recession could temporarily reduce industrial demand for silver. The consumer electronics market has shown signs of saturation, and any slowdown in solar installations or EV production would reduce physical offtake. However, government clean energy mandates in the U.S., EU, and China provide a policy floor under solar demand that didn’t exist in previous cycles.
Tariff and Trade Volatility
Silver’s price action in 2026 has been heavily influenced by trade policy. Unexpected tariff developments — either positive or negative — can create sharp short-term moves. The January SCOTUS ruling striking down broad tariffs and Trump’s subsequent decision to exempt critical minerals (including silver) from tariffs caused a brief 8% drop before prices recovered. Investors should expect continued volatility around trade headlines.
Paper Market Dynamics
Despite the physical tightness, the paper silver market — futures, ETFs, and LBMA unallocated accounts — still dwarfs physical trading. Coordinated short-selling or algorithmic selling during thin trading hours can suppress prices in the short term. The 2019 conviction of J.P. Morgan executives for precious metals market manipulation is a reminder that these risks are real, not theoretical.
A Revised Timeline for Silver Prices
Our original article projected a timeline of silver reaching $100 by 2028-2030. That timeline proved far too conservative — silver hit $121 within months. Here’s our revised outlook based on current conditions:
| Period | Key Drivers | Expected Range |
|---|---|---|
| Q2 2026 | Base building, seasonal demand pickup, gold stabilization above $4,500 | $72 – $85 |
| Q3-Q4 2026 | Supply deficit tightens into industrial peak season, gold retests $5,000+ | $85 – $110 |
| 2027 | Mine supply fails to respond, ratio compression accelerates, potential retail silver squeeze | $95 – $140 |
| 2028-2030 | Structural deficit deepens, potential monetary system shifts, new industrial applications mature | $100 – $200+ |
The base case is that silver reclaims $100 per ounce by late 2026 or early 2027. The bull case — driven by a combination of a gold breakout above $5,500, worsening supply deficits, and a physical delivery squeeze — could see silver retesting its January highs or pushing higher.
What This Means for Silver Investors
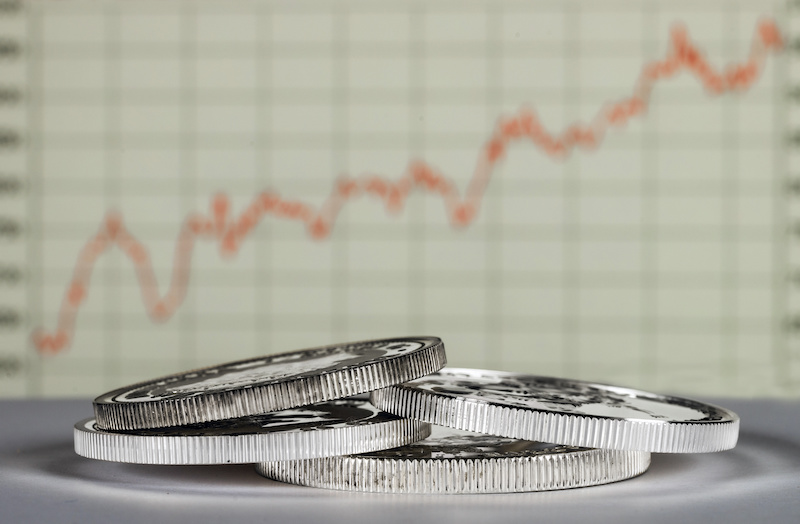
Silver’s current price near $77 represents a 37% discount from its January high. For investors who missed the initial run to $121, this pullback offers a second chance to accumulate physical silver at prices that may look cheap in hindsight.
Dealer premiums on physical silver have dropped significantly during the consolidation. 100 oz silver bars are trading with premiums as low as 1.7% over spot, and 10 oz silver bars can be found for under $1.50/oz over spot. 1 oz silver coins like American Silver Eagles remain popular for their liquidity and IRA eligibility, with secondary market premiums as low as 6% to 8% over spot.
For cost-conscious investors, our closest to spot silver comparison tool tracks premiums across 27+ online dealers in real time, helping you find the lowest-premium silver available today. As we saw in January, premiums can spike rapidly once retail demand accelerates — locking in low premiums now is a strategic advantage.
At $100 per ounce, a 100 oz silver bar would be worth $10,000. A tube of 20 American Silver Eagles would be worth $2,000. The math is compelling for investors who believe the structural forces driving silver higher remain intact.
We do.
This article is for informational purposes only and does not constitute investment advice. Silver prices are volatile, and past performance does not guarantee future results. Always consult with a qualified financial advisor before making investment decisions.
FAQ
Has silver ever hit $100 per ounce before?
Yes. Silver reached an intraday high of $121 per ounce on January 29, 2026, breaking above $100 for the first time in history. The previous all-time high was $49.45 in April 2011.
Why did silver fall from $121 back to $77?
After any parabolic move, profit-taking and a strengthening dollar drove a correction. Silver dropped to $67 in early February before recovering. This type of pullback is normal and has precedents — silver fell 35% from its 2011 peak within weeks before stabilizing.
What is the silver supply deficit?
The global silver market has been in a structural deficit since 2021, with demand exceeding supply by a cumulative 820 million ounces over five years. The Silver Institute projects another 67 million ounce deficit in 2026.
Will silver hit $100 again in 2026?
Multiple major bank analysts see silver reaching or exceeding $100 in 2026. Citigroup forecasts $150/oz, TD Securities projects a high of $118/oz, and J.P. Morgan sees an average of $81/oz with higher peaks. The structural case — persistent supply deficits, growing industrial demand, and a gold bull market — supports a return to triple digits.
")


