The American Silver Eagle is the best-selling silver bullion coin in the world and the flagship of the United States Mint’s bullion program. Since its debut in 1986, the Mint has produced more than 700 million Silver Eagles across bullion, proof, and uncirculated (burnished) versions — a production run spanning four decades of shifting investor demand, economic crises, supply disruptions, and evolving collector interest.
Annual mintage figures are one of the most important reference points for both investors and collectors. For investors, mintage trends reveal how demand responds to economic conditions and silver bullion prices. For collectors, mintage numbers help identify scarce years, low-production varieties, and the relative availability of specific issues in the secondary market.
This guide covers the legislative origins of the Silver Eagle program, the mintage history by year, and what the production numbers mean for buyers today. For notable varieties and collector-premium issues, see our companion guide to American Silver Eagle key dates and varieties.
Origins: The Liberty Coin Act of 1985
The American Silver Eagle program was established by the Liberty Coin Act (Public Law 99-61), signed by President Ronald Reagan on July 9, 1985. The Act had two objectives: to reduce the government’s Defense National Stockpile of silver and to create a trusted, government-backed silver bullion coin for private investors.
The legislation set specifications that have remained unchanged for four decades. Each American Silver Eagle contains one troy ounce of .999 fine silver (31.103 grams), measures 40.6 millimeters in diameter, and features reeded edges. The Act required a design “symbolic of Liberty” on the obverse and “of an eagle” on the reverse. For a detailed breakdown of physical specifications, see our American Silver Eagle specifications guide.
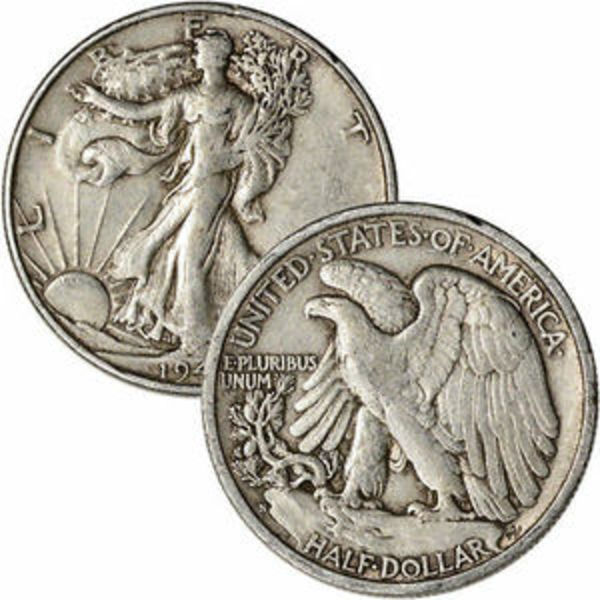
The obverse design is Adolph A. Weinman’s Walking Liberty, originally created for the half dollar minted from 1916 to 1947 — widely regarded as one of the most beautiful motifs in American coinage. The original reverse, by John Mercanti, depicted a heraldic eagle behind a shield and was used from 1986 through mid-2021 (now referred to as the Type 1 design). In mid-2021, the Mint introduced a new reverse by Emily Damstra featuring an eagle carrying an oak branch (the Type 2 design), along with an anti-counterfeit reeded edge variation — the first major design change in the program’s history.
The National Defense Stockpile
From 1986 through the early 2000s, silver for the program came from the National Defense Stockpile — a strategic reserve of materials maintained by the U.S. government for military and industrial use. By 2002, the stockpile was nearly exhausted. Congress amended the law to allow the U.S. Mint to purchase silver on the open market, ensuring continued production.
How Silver Eagle Mintage Works
Unlike proof and special edition coins, which have predetermined production limits announced by the Mint, Silver Eagle bullion coins are minted on demand. The U.S. Mint produces bullion Silver Eagles based on monthly orders from its network of Authorized Purchasers — the wholesale distributors who buy directly from the Mint at the LBMA silver spot price plus a $3.05 per coin premium and supply the dealer market.
This demand-driven model means annual bullion mintage fluctuates significantly based on investor appetite, silver bullion prices, and broader economic conditions. A year with strong safe-haven demand (like 2020) can see production more than double compared to a year of subdued investor interest (like 2018).
Each year, the Mint produces up to three versions, each with a separate mintage figure and market:
Bullion coins are the investment-grade version, sold through Authorized Purchasers in large quantities. These have the highest annual mintages — often tens of millions — and are the coins most investors buy and hold.
Proof coins are collector-grade strikes with a mirror-like finish, produced at the West Point Mint and sold directly to the public through the U.S. Mint’s website. Proof mintages are significantly lower, typically in the hundreds of thousands, and carry higher premiums reflecting their finish quality and limited production.
Uncirculated (Burnished) coins feature a soft, matte-like finish produced using specially prepared blanks. These carry a “W” mint mark (West Point) and are intended primarily for collectors. Burnished Silver Eagles were first issued in 2006 and have not been produced every year since, adding to their appeal when they do appear. See our Burnished American Silver Eagle guide for details on this category.
American Silver Eagle Mintage by Year
The table below shows annual production figures for bullion, proof, and uncirculated (burnished) Silver Eagles. Bullion figures represent coins sold to Authorized Purchasers. Proof and uncirculated figures represent total Mint sales. Special varieties and privy marks are listed separately beneath the standard issue for each year.
| Year | Bullion | Proof | Uncirculated (Burnished) |
|---|---|---|---|
| 1986 | 5,393,005 | 1,446,778 | — |
| 1987 | 11,442,335 | 904,732 | — |
| 1988 | 5,004,646 | 557,370 | — |
| 1989 | 5,203,327 | 617,694 | — |
| 1990 | 5,840,110 | 695,510 | — |
| 1991 | 7,191,066 | 511,924 | — |
| 1992 | 5,540,068 | 498,543 | — |
| 1993 | 6,763,762 | 405,913 | — |
| 1994 | 4,227,319 | 372,168 | — |
| 1995 | 4,672,051 | 407,822 | — |
| 1995-W | — | 30,125 | — |
| 1996 | 3,603,386 | 498,293 | — |
| 1997 | 4,295,004 | 440,315 | — |
| 1998 | 4,847,549 | 450,728 | — |
| 1999 | 7,408,640 | 549,330 | — |
| 2000 | 9,239,132 | 600,743 | — |
| 2001 | 9,001,711 | 746,398 | — |
| 2002 | 10,539,026 | 647,342 | — |
| 2003 | 8,495,008 | 747,831 | — |
| 2004 | 8,882,754 | 801,602 | — |
| 2005 | 8,891,025 | 816,663 | — |
| 2006 | 10,676,522 | 1,092,477 | 466,573 |
| 2006-P | — | 248,875 (Rev Pr) | — |
| 2007 | 9,028,036 | 821,759 | 621,333 |
| 2008 | 20,583,000 | 700,979 | 533,757 |
| 2009 | 30,459,000 | — | — |
| 2010 | 34,764,500 | 849,861 | — |
| 2011 | 40,020,000 | 847,473 | 409,766 |
| 2011-S | — | — | 99,882 |
| 2011-P | — | 99,882 (Rev Pr) | — |
| 2012 | 33,742,500 | 832,779 | 226,120 |
| 2012-S | — | 281,792 | — |
| 2012-S | — | 224,935 (Rev Pr) | — |
| 2013 | 42,675,000 | 934,331 | 221,981 |
| 2013-W | — | 235,689 | — |
| 2013-W | — | 235,689 (Rev Pr) | — |
| 2014 | 44,006,000 | 894,614 | 253,169 |
| 2015 | 47,000,000 | 696,001 | 200,016 |
| 2016 | 37,701,500 | 595,664 | 216,422 |
| 2017 | 18,065,500 | (W) 389,994 / (S) 123,906 | 176,739 |
| 2018 | 15,700,000 | (W) 352,141 / (S) 158,761 | 138,947 |
| 2019 | 14,863,500 | (W) 319,086 / (S) 146,735 | 138,140 |
| 2019-S Enh Rev Pr | — | 29,823 | — |
| 2020 | 30,089,500 | (W) 357,048 / (S) 146,729 | (W) 154,261 |
| 2020-W V75 | — | 75,000 | — |
| 2021 Type 1 | 25,675,500 | 299,509 | 174,470 |
| 2021 Type 2 | 2,599,500 | (W) 311,982 / (S) 238,454 | — |
| 2022 | 15,963,500 | (W) 499,070 / (S) 200,937 | 160,025 |
| 2023 | 24,750,000 | (W) 436,375 / (S) 177,647 | 137,018 |
| 2024 | 24,862,000 | (W) 263,829 | 85,905 |
| 2025 | 11,568,000* | (W) 299,043 | 71,011 |
| 2025 Navy Privy | — | 99,892 | — |
| 2025 Marines Privy | — | 98,455 | — |
| 2025 Army Privy | — | 99,963 | — |
| 2026 | 8,820,500* | (W) 299,617 | — |
2025 bullion figure is through November. 2026 bullion figure is through June. Sales data updated August 2026 from U.S. Mint published reports.
Mintage Trends: What the Numbers Tell Us
The Early Years (1986–2000)
The program launched in November 1986, with the first coins struck at the San Francisco Mint on October 29, 1986. First-year bullion production reached 5,393,005 coins — a modest figure by later standards, but significant for a new program still building investor awareness. Annual bullion mintages through the 1990s generally ranged between 3.6 million and 7.4 million, with demand driven largely by silver’s role as a portfolio diversification tool.
The lowest mintage years from this era — particularly 1994 (4,227,319) and 1996 (3,603,386) — have become modestly desirable among collectors building complete year sets, though they remain widely available.
The Investment Boom (2001–2016)
Demand accelerated sharply after the turn of the millennium. Economic uncertainty following 2001 pushed bullion mintage above 10 million for the first time in 2002 (10,539,026). The 2008 financial crisis supercharged demand: the Mint produced 20,583,000 bullion Eagles in 2008 and 30,459,000 in 2009 as investors flooded into physical silver. During several years in this period, the Mint was unable to keep up with demand and temporarily suspended sales or implemented allocation programs for Authorized Purchasers.
Production peaked at 47,000,000 coins in 2015 — the highest annual bullion mintage in the program’s history — driven by sustained interest in physical silver bullion as prices traded between $14 and $18 per ounce. After 2016’s 37.7 million, output dropped sharply to 18 million in 2017, signaling that the post-crisis accumulation wave had crested.
Pandemic-Era Disruption (2020–2021)
The COVID-19 pandemic drove a surge in investor demand while constraining production capacity. In 2020, despite a temporary shutdown of the West Point Mint and reduced staffing across all facilities, the Mint produced over 30 million bullion Silver Eagles. The West Point closure briefly shifted production to the Philadelphia Mint, which struck approximately 240,000 Silver Eagles during an emergency production run. These 2020 (P) coins — identifiable only by Monster Box tracking numbers — have become a distinct collectible.
The 2021 mintage year was uniquely split between two designs: the original Mercanti reverse (Type 1) and the new Damstra reverse (Type 2), with Type 1 production ending mid-year and Type 2 beginning shortly after. Combined bullion output was approximately 28.3 million coins, with the bulk in Type 1 (25.7 million) and just 2.6 million in Type 2. The scarcity of the 2021 Type 2 relative to other recent years has made it a point of collector interest.
The Demand Collapse (2022–2026)
Mintage figures moderated from the pandemic highs, with 2022 producing approximately 16 million bullion coins as silver bullion premiums remained elevated and investors shifted focus. A brief rebound in 2023–2024 (roughly 25 million each year) proved temporary.
The most dramatic shift came in 2025–2026. Bullion Silver Eagle sales fell to 11.6 million through November 2025, with monthly production dipping as low as 305,000 coins in July. The decline accelerated in 2026: after a strong January of 4.8 million coins, monthly sales dropped steadily. In May 2026, the Mint reported zero bullion Silver Eagle sales — the first full-month shutout since the program began. June saw a modest restart at 260,000 coins.
This production collapse tracks a sharp pullback in retail demand. With silver spot prices elevated and Authorized Purchaser premiums at $3.05 per coin, the total cost of new-year Silver Eagles pushed many investors toward lower-premium alternatives — generic silver bullion rounds, bars, and secondary market Silver Eagles from prior years. For more on how these premium dynamics work, see our Silver Eagle premiums analysis and our guide to understanding Silver Eagle premiums.
The 2026 Semiquincentennial
Despite the bullion sales decline, 2026 carries special significance for collectors. The 2026 Silver Eagle marks America’s 250th anniversary with a historic first: dual dates reading “1776 ~ 2026” on the obverse, along with a Liberty Bell privy mark inscribed with “250.” It is the first time in the program’s 40-year history that the Mint has struck Silver Eagles with dual dates. For details on all commemorative editions, see our guide to Silver Eagle special editions and anniversary sets.
What Mintage Numbers Mean for Buyers
For bullion investors focused on accumulating silver ounces at the lowest premium, mintage figures matter primarily through their effect on supply. Years with low Mint production — like 2017–2019 and 2025–2026 — tend to produce tighter dealer inventory and wider premiums on current-year coins. In those environments, secondary market Silver Eagles (random year and cull condition) from higher-mintage years become the most cost-effective way to own Eagles.
For collectors, mintage figures are one factor in long-term value — but only one. Condition, grading, special varieties, and market demand all play significant roles. A low-mintage year does not automatically command a high premium; the 1994 Silver Eagle has a lower mintage than the 2019-S Enhanced Reverse Proof, but the latter trades at multiples of the former because of its limited collector edition status. For more on which issues carry collector premiums and why, see our guide to American Silver Eagle key dates and varieties.
Frequently Asked Questions
What is the highest-mintage American Silver Eagle?
The 2015 Silver Eagle holds the record at 47,000,000 bullion coins — a figure driven by sustained investor demand for physical silver bullion while silver spot prices traded between $14 and $18 per ounce.
What is the lowest-mintage bullion Silver Eagle?
The 1996 Silver Eagle has the lowest bullion mintage at 3,603,386 coins. Among all Silver Eagle varieties (including proof and special editions), the 2019-S Enhanced Reverse Proof (29,823 coins) and the 1995-W Proof (30,125 coins) are the two lowest-mintage issues.
Why did Silver Eagle sales hit zero in May 2026?
Authorized Purchasers placed no orders for bullion Silver Eagles in May 2026 — the first full-month shutout in program history. Elevated silver spot prices combined with the Mint’s $3.05 per coin premium pushed the total wholesale cost to a level where retail demand could not absorb supply, especially as investors shifted toward lower-premium silver bullion alternatives.
What’s the difference between bullion, proof, and burnished Silver Eagles?
Bullion coins are investment-grade, sold through Authorized Purchasers at spot plus a fixed premium. Proof coins have a mirror finish, are sold directly by the Mint in limited quantities, and carry higher premiums. Burnished (uncirculated) coins have a soft, matte finish, carry a “W” mint mark, and are produced in the smallest quantities.
Can Silver Eagles be held in an IRA?
American Silver Eagles meet the .999 fineness requirement for inclusion in a precious metals IRA under IRC Section 408(m). IRA-eligible coins must be held by an approved custodian and stored in an approved depository. See our Silver Eagle IRA guide for custodian requirements and setup details.
How do I buy Silver Eagles at the lowest premium?
FindBullionPrices.com compares live Silver Eagle bullion prices from trusted online dealers. For the lowest premiums, compare random year Silver Eagles and cull condition Silver Eagles, which trade below current-year pricing. For more on how Silver Eagle premiums compare to other silver bullion options, see Silver Eagles vs. silver bars.
Related Guides
- American Silver Eagle Key Dates and Varieties
- Cheapest American Silver Eagle Coins
- Understanding Silver Eagle Premiums
- Silver Eagle Premiums: COVID to Today
- 2026 American Silver Eagle Buyer’s Guide
- Silver Eagle Special Editions and Anniversary Sets
- Burnished American Silver Eagle Guide
- Silver Eagle IRA Guide
- American Silver Eagle Specifications
Notes and Sources
Mintage and sales figures are sourced from U.S. Mint published sales reports. Bullion figures represent coins sold to Authorized Purchasers and may differ slightly from final audit figures. Proof and uncirculated figures represent total sales. Where the Mint has revised figures after initial publication, the most recent available data is used.
Annual sales figures for recent years may reflect year-to-date totals rather than final calendar-year production. The U.S. Mint updates sales figures periodically; final figures for a given year are typically confirmed in January or February of the following year.
This article is for informational and educational purposes only and should not be considered financial or investment advice. Silver Eagle values fluctuate with precious metals markets and collector demand. Mintage figures are sourced from U.S. Mint published data and may be subject to revision.